
Understanding Your Lipid Panel
A lipid panel is one of the most common blood tests in primary care, but for many people, the results feel abstract. You’ll often hear “your cholesterol is high” or “it looks okay,” without much explanation of what that really means.
In reality, this test gives us a detailed picture of how fats are moving through your bloodstream and how that may affect your heart and blood vessels over time.
Before looking at actual numbers, it helps to understand what each part represents.
LDL Cholesterol: The One That Builds Up
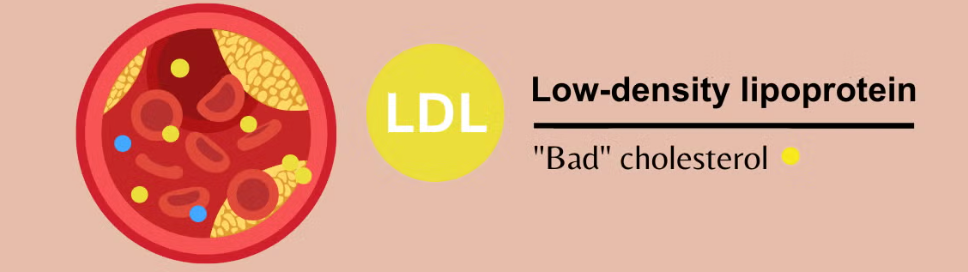
LDL cholesterol is often called “bad cholesterol,” but a more accurate way to think about it is this: it delivers cholesterol to your body.
Your body actually needs cholesterol for hormones and cell structure. The problem starts when there is too much LDL circulating in the blood.
Over time, excess LDL can settle along the walls of your blood vessels. Gradually, this leads to a buildup that narrows the space where blood flows. This process happens slowly and silently, often over many years.
That’s why LDL is the main number we focus on when we think about long-term heart risk.
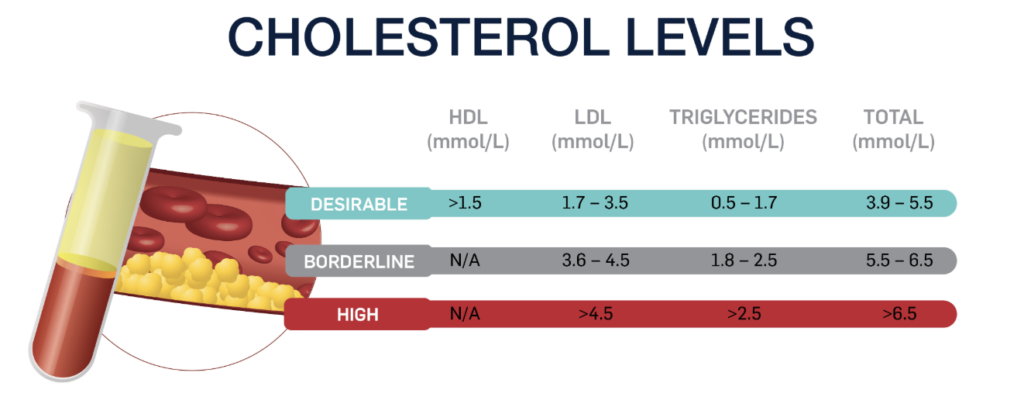
In general, we aim for LDL levels below 100 mg/dL, and even lower in patients with higher risk.
HDL Cholesterol: The Cleanup System
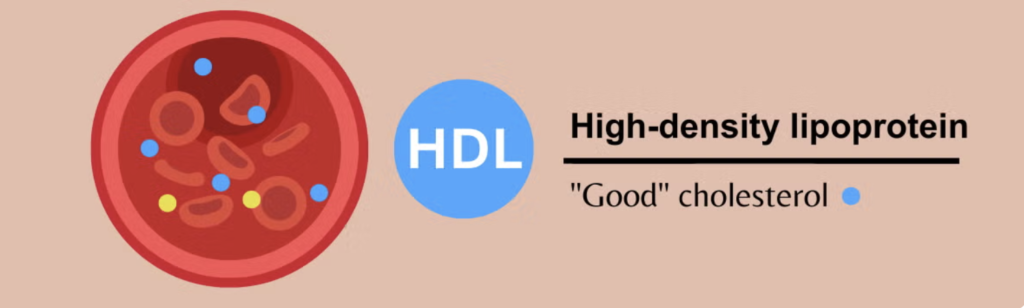
HDL cholesterol works in the opposite direction.
Instead of delivering cholesterol, it helps remove excess cholesterol from the bloodstream and carries it back to the liver, where it can be processed and cleared.
You can think of HDL as part of the body’s cleanup system. Higher levels are generally associated with better balance in the system.
That said, HDL doesn’t completely cancel out high LDL. It helps—but the overall picture still matters.
A level above 50–60 mg/dL is typically considered a good range.
Triglycerides: A Reflection of Diet and Metabolism
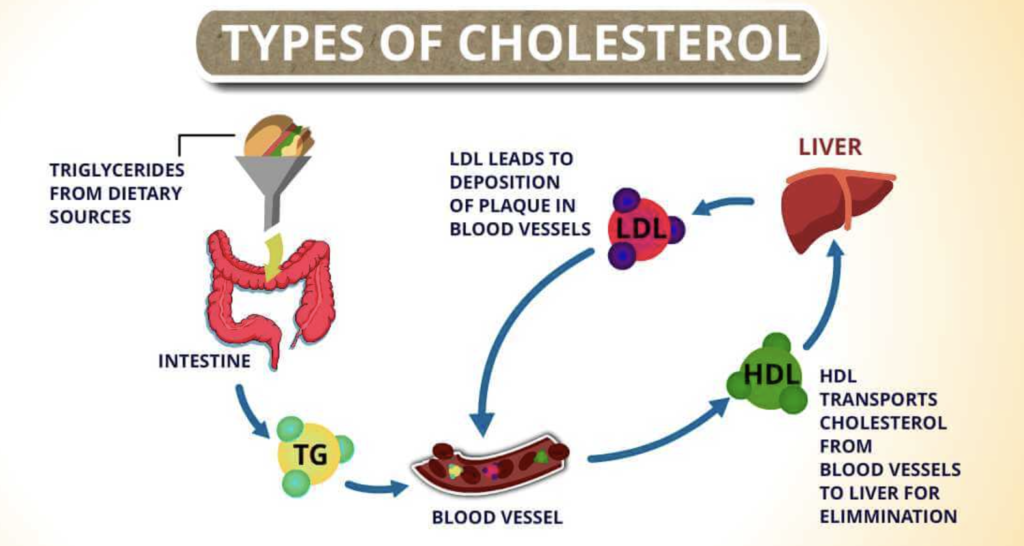
Triglycerides are a different type of fat. They mainly come from the food you eat, especially extra calories from carbohydrates and sugars.
When your body has more energy than it needs at the moment, it stores that energy as triglycerides.
When triglycerides are elevated, it often reflects how your body is processing food, particularly sugars, refined carbs, and alcohol. It can also be an early sign that your metabolism is under strain.
We generally aim for levels below 150 mg/dL.
Unlike LDL, triglycerides don’t directly “stick” to artery walls in the same way, but they often show up alongside other patterns that increase risk.
Total and Non-HDL Cholesterol: The Bigger Picture
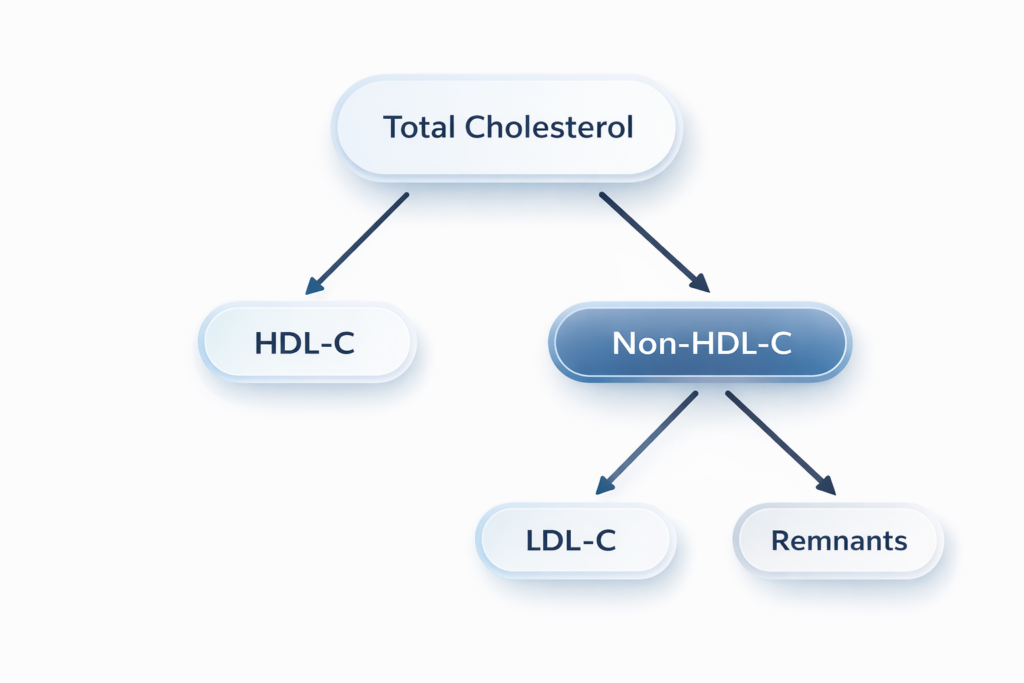
Total cholesterol is simply the sum of all cholesterol in your blood. It gives a general overview, but it doesn’t tell the whole story.
Two people can have the same total cholesterol and very different health risks depending on how that number is divided between LDL and HDL.
That’s where non-HDL cholesterol becomes useful. This number includes all the cholesterol that can contribute to buildup in the arteries.
In many cases, especially when triglycerides are elevated, this gives a more accurate sense of overall risk than LDL alone.
Cholesterol Ratios: Understanding Balance
Beyond individual numbers, we also look at how these values relate to each other.
The total cholesterol to HDL ratio gives a sense of balance; how much cholesterol is present compared to how much is being cleared. Lower ratios suggest a healthier balance.
Another helpful relationship, even if it’s not always listed on the report, is the triglyceride to HDL ratio. This can give clues about how well the body is handling sugars and energy.
These ratios don’t replace individual numbers, but they add context.
Let’s Walk Through This Report!
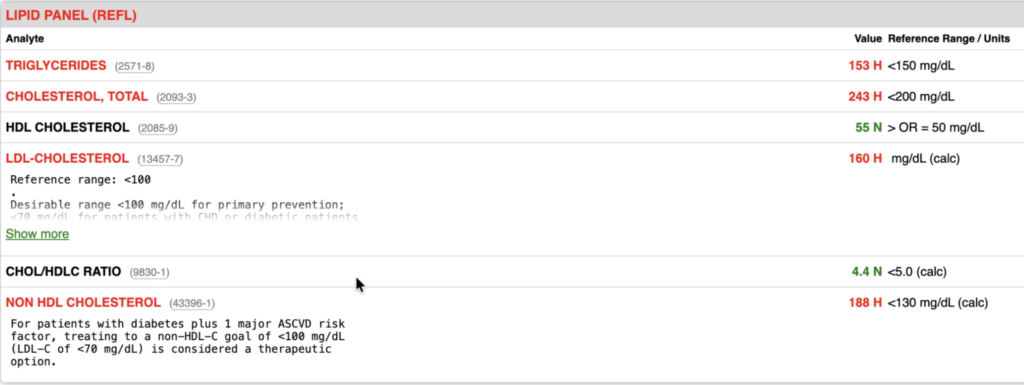
Looking at this specific panel of my patient:
Triglycerides are slightly elevated at 153, which suggests a mild metabolic component—often related to diet, especially refined carbohydrates or alcohol.
Total cholesterol is elevated at 243, but this mainly reflects what we already see in the breakdown.
HDL is 55, which is a positive finding and offers some protection.
LDL is 160, which is the most important concern here. This level increases the likelihood of gradual buildup in the arteries over time.
Non-HDL cholesterol is also elevated, reinforcing that the overall “burden” of cholesterol that can contribute to buildup is higher than ideal.
The cholesterol-to-HDL ratio is 4.4, which falls within an acceptable range, but it does not outweigh the elevated LDL.
What This Means Overall
This pattern suggests two things happening at the same time.
First, there is an elevated LDL level, which is the main driver of long-term cardiovascular risk.
Second, there is a mild elevation in triglycerides, which often reflects how the body is processing diet and energy.
HDL is in a good range, which helps, but it does not fully offset the other findings.
Final Thought
A lipid panel is less about labeling something as “good” or “bad,” and more about understanding patterns early.
Because the most important thing about cholesterol is this:
You don’t feel it.
But over time, it reflects what’s happening quietly inside your body, and gives you the opportunity to adjust before it becomes a problem.